
The Real Estate Progression
Before I get started, let me say that in my opinion, if you do not enjoy working with your hands and doing fix-up projects then real estate is not for you. If you hire a property manager, everyone will get rich except you. If this is you then just invest in a low cost index fund with dollar cost averaging and enjoy the carefree gainz. You might also want to read Is Scooby Rich to see what being rich means to me – hint: not *things*, freedom. You might also want to start by watching this video:
Progression for owning three homes:
- Pay off all consumer debt (see how to get rich)
- Save a 20% down payment, win the lottery, or get an inheritance :)
- Buy your first property. Remember that buying real estate is not always a good decision as it depends on the stability of your job market as well as the cost of renting relative to the cost of buying. If you live in a town where the only employer is a steel mill, do NOT buy real estate but rather invest in an index fund using dollar cost averaging. If you are in a rent controlled apartment for $1000/mo and buying your own place will cost $7000/mo then rent and put that extra $6000/mo into that same index fund using dollar cost averaging. Qualifying for a loan can be tough, consider asking parents to co-sign. Your first house will not be a dream house and remember that you will probably have to take on roomates.
- Start saving for your second home.
- After you have your down payment for the second home, move into an apartment and rent out your house. This seems stupid but its not because what this does is establishes rental income. Getting qualified for a loan on a second house is tough. Having a track record of rental income makes it a lot easier to qualify. A lender will not be impressed with a “we’re going to rent our house out” but they WILL be impressed with a tax return that shows $XXX,YYY.ZZ in rental income. When you buy a second house, it will be your primary residence. Again because getting a loan for a primary residence is a lot easier than getting a loan for a rental property. Buy yourself a fixer-upper.
- Add sweat equity. Live in the house while you slowly renovate it and add to it as you have the money to do so.
At this point, probably 10-20 years has gone by and you now have a lot of options in front of you. The loan on the first place is paid off or nearly paid off depending on if you got a 15 or a 30 year mortgage. The house you live in is really nice. If you love your job then consider doing it again – move into an apartment, rent out house #2, buy house #3. If your job sucks then QUIT and follow your passions! The first house will provide enough rental income to keep your household afloat. If not, rent out a room or two in the house you are living in to supplement your income. Start that company! Have a blast.
Declaring Rental Income
This is a good time to talk about taxes. Don’t cheat on your taxes by hiding rental income, not only is it illegal, but its the dumbest financial mistake you could make! Renting rooms is rental income. Renting the whole house is rental income – declare it on your taxes! Without that income you will never qualify for a loan on your next house. Also, real estate is the easiest way for normal people to lower or eliminate their taxes. Once you turn your first house into a rental property you can depreciate it which is a huge tax savings. Not only that, I strongly recommend setting up a LLC which owns the rental property. In California this costs $800/year and provides you great legal protections, and just as important, it will reduce your taxes further because of the Trumps newly enacted passthru income tax reductions. There is no reason to cheat on taxes when its so easy to avoid them legally!
A tale of two high school grads
Lets look at why buying a house can be a very good thing. Jef and Scooby, two high school grads both get really lucky and win $40,000 in the lottery. Jef really “needs” a new car so he “invests” in a brand new Ford Mustang GT Premium and is the envy of all his friends. Scoob decides to buy $200,000 house and use the 40k for a down payment. He gets his parents to co-sign and gets roomates to help pay the mortgage.
… 20 years later …
Jef’s Mustang has 200,000 miles on it and is a maintenance nightmare so he sells it for $500. Scoob’s house appreciated at the same rate that houses in USA did in the 20 years from 1980 to 2000 which is 29% so his house is worth $258,000. His 30 year loan only has 80k left to pay so his equity is $178,000
Both Jef and Scoob were given the same $40,000. After 20 years, Jef’s $40,000 car gets him $500 when he sells it. After that same 20 years, Scoob sells his house and gets $178,000. Which do you want in 20 years – $500 or $178,000?
Real Estate Appreciation Rates
In my video on real estate investing, I heard the following comments about me being lucky a lot:
- You were lucky with appreciation, it doesnt go up much in value now.
- You are lucky to be in california, other places dont appreciate as much
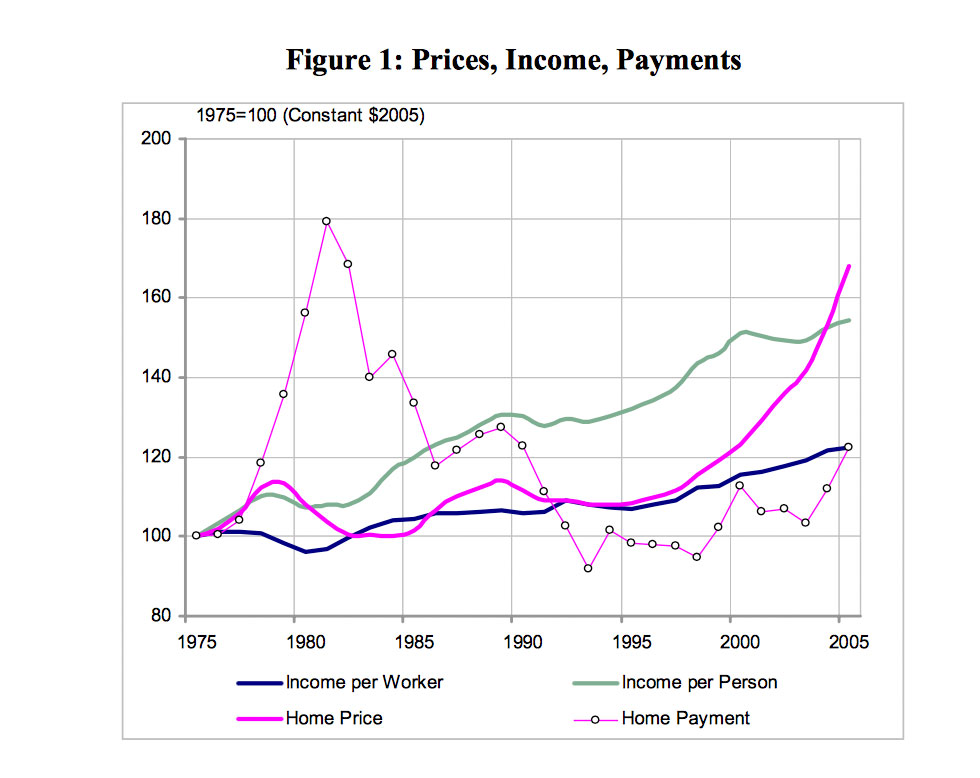
So lets start with #1 which is blatantly false. If you look at the chart, home prices basically remained stagnant the 20 years from 1975 to 1995. In the 70s, property values soared … and I missed all that. Its only after 1995 when prices started going up to crazy heights (only to crash later). I bought my first house in the 80s when appreciation were at record lows and interest rates were two digit. That was NOT the golden era of real estate by any means but yet it was still a good investment. I was unable to find any charts showing yearly appreciation since the 1960s. I am actually shocked that its so hard to find a chart showing yearly nationwide housing appreciation since 1950, if you find it, PLEASE post!
So the second point about California being a lucky investment, kinda maybe.
Lets look at my investment horizon – from 1980 to 2000 (no charts showing 2018)
Average USA – 93k to 119k (28% appreciation)
California – 167k to 211k (26% appreciation)
Michigan – 77k to 115k (49% appreciation)
Nebraska – 75k to 88k (17% appreciation)
Delaware – 88k to 130k (48% appreciation)
Massachusetts – 95k to 185k (95% appreciation)
The premise that California is a golden real estate investment opportunity is not backed up by the data. For the period 1980 to 2000 California was below the nationwide average for housing appreciation. The lucky investors were in places like Delaware and Massachusetts!
I maintain that my real estate investment has been very average.
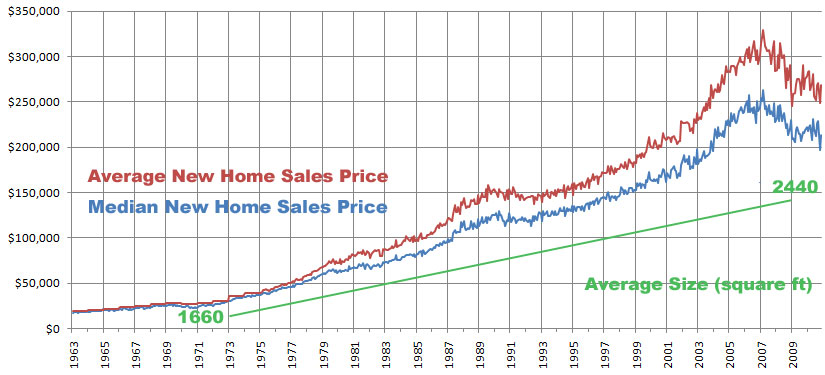
One thing to note is that the 28% appreciation I quoted for 1980-2000 is for all homes. When you look at the prices of new home sales, the numbers look a lot better but remember that the average home gets a lot bigger each year so new home prices should rise faster.
Historical Appreciation Rates in America
Median Home Values

                     2000      1990      1980      1970     1960     1950    1940

                          Adjusted to 2000 dollars
United States     $119,600  $101,100   $93,400   $65,300  $58,600  $44,600  $30,600

Alabama            $85,100   $68,600   $67,100   $46,900  $42,400  $27,100  $16,800
Alaska            $144,200  $120,600  $151,000   $87,200  $44,800  $21,100     NA
Arizona           $121,300  $102,300  $108,500   $62,600  $54,700  $36,000  $14,600
Arkansas           $72,800   $59,200   $61,600   $40,300  $33,000  $24,800  $11,400
California        $211,500  $249,800  $167,300   $88,700  $74,400  $57,900  $36,700
Colorado          $166,600  $105,700  $126,900   $66,400  $60,600  $43,300  $21,800
Connecticut       $166,900  $227,200  $129,900   $97,900  $82,300  $71,900  $48,000
Delaware          $130,400  $127,900   $87,900   $65,700  $61,100  $55,000  $43,300
Dist. of Columbia $157,200  $158,300  $136,200   $81,800  $75,900  $87,800  $78,800
Florida           $105,500   $98,500   $89,300   $57,600  $58,100  $40,100  $23,100
Georgia           $111,200   $91,100   $73,000   $56,100  $46,800  $31,700  $20,400
Hawaii            $272,700  $313,400  $233,800  $134,800 $103,000  $74,400      NA
Idaho             $106,300   $74,400   $90,300   $54,200  $52,200  $35,500  $16,700
Illinois          $130,800  $103,400  $104,500   $76,000  $72,400  $52,400  $34,100
Indiana            $94,300   $68,900   $73,600   $53,000  $50,300  $37,700  $25,000
Iowa               $82,500   $58,600   $80,400   $53,400  $48,800  $38,300  $23,400
Kansas             $83,500   $66,700   $74,800   $46,500  $45,800  $33,100  $18,000
Kentucky           $86,700   $64,500   $67,700   $48,400  $43,400  $32,000  $21,600
Louisiana          $85,000   $74,700   $85,100   $56,100  $52,700  $31,100  $14,700
Maine              $98,700  $111,700   $75,000   $49,200  $43,400  $29,400  $20,900
Maryland          $146,000  $148,800  $115,400   $71,800  $58,600  $48,700  $31,500
Massachusetts     $185,700  $208,000   $95,800   $79,100  $68,000  $55,400  $39,900
Michigan          $115,600   $77,400   $77,200   $67,200  $59,100  $45,400  $29,800
Minnesota         $122,400   $94,500  $105,100   $69,100  $63,100  $47,300  $31,500
Mississippi        $71,400   $58,300   $62,200   $43,000  $38,900  $25,200  $12,400
Missouri           $89,900   $76,400   $72,600   $55,300  $53,700  $38,800  $24,900
Montana            $99,500   $72,300   $92,000   $53,800  $53,700  $35,100  $17,200
Nebraska           $88,000   $64,400   $75,200   $47,600  $46,300  $35,900  $22,400
Nevada            $142,000  $122,300  $136,000   $86,000  $74,900  $53,700  $20,700
New Hampshire     $133,300  $165,300   $95,000   $63,000  $52,700  $37,600  $26,100
New Jersey        $170,800  $207,400  $119,200   $89,900  $76,900  $63,100  $47,100
New Mexico        $108,100   $89,600   $89,700   $49,900  $52,700  $34,500   $6,800
New York          $148,700  $168,100   $90,300   $86,400  $75,400  $61,500  $45,700
North Carolina    $108,300   $84,100   $71,300   $49,200  $39,400  $29,700  $18,800
North Dakota       $74,400   $64,900   $86,900   $49,900  $48,300  $32,700  $16,900
Ohio              $103,700   $81,100   $88,900   $67,600  $66,000  $50,300  $35,500
Oklahoma           $70,700   $61,500   $70,500   $42,600  $38,900  $31,700  $13,500
Oregon            $152,100   $85,700  $112,600   $59,100  $51,700  $41,500  $24,400
Pennsylvania       $97,000   $89,100   $77,400   $52,200  $50,300  $42,400  $33,400
Rhode Island      $133,000  $170,600   $92,600   $69,900  $60,600  $59,200  $40,000
South Carolina     $94,900   $78,100   $69,500   $49,900  $37,000  $31,000  $22,300
South Dakota       $79,600   $57,700   $72,400   $43,800  $43,400  $32,800  $16,800
Tennessee          $93,000   $74,600   $70,500   $48,000  $40,900  $31,900  $19,000
Texas              $82,500   $76,100   $77,400   $46,100  $43,400  $35,200  $17,600
Utah              $146,100   $88,000  $113,400   $64,500  $62,100  $44,900  $24,100
Vermont           $111,500  $122,000   $83,500   $63,000  $47,800  $38,000  $29,500
Virginia          $125,400  $116,300   $95,000   $65,700  $53,200  $39,900  $27,400
Washington        $168,300  $119,300  $118,600   $71,100  $57,700  $43,400  $24,500
West Virginia      $72,800   $61,200   $76,200   $43,400  $37,400  $33,200  $24,500
Wisconsin         $112,200   $79,900   $96,200   $66,400  $62,100  $48,000  $33,600
Wyoming            $96,600   $78,700  $118,400   $58,800  $60,600  $41,300  $22,600

Note:  To adjust for inflation, the 1940 to 1990 median home values were adjusted to 2000
       dollars using the appropriate CPI-U-RS adjustment factor.

                               Year:       1940      1950     1960     1970     1980      1990
                  Adjustment factor:   10.406639  6.057971  4.927308 3.840735 1.979479  1.277636


Median Home Values: Unadjusted


                     2000      1990      1980      1970     1960     1950    1940

United States     $119,600   $79,100   $47,200   $17,000  $11,900   $7,354  $2,938

Alabama            $85,100   $53,700   $33,900   $12,200   $8,600   $4,473  $1,610
Alaska            $144,200   $94,400   $76,300   $22,700   $9,100   $3,477     NA
Arizona           $121,300   $80,100   $54,800   $16,300  $11,100   $5,935  $1,400
Arkansas           $72,800   $46,300   $31,100   $10,500   $6,700   $4,087  $1,100
California        $211,500  $195,500   $84,500   $23,100  $15,100   $9,564  $3,527
Colorado          $166,600   $82,700   $64,100   $17,300  $12,300   $7,151  $2,091
Connecticut       $166,900  $177,800   $65,600   $25,500  $16,700  $11,862  $4,615
Delaware          $130,400  $100,100   $44,400   $17,100  $12,400   $9,079  $4,159
Dist. of Columbia $157,200  $123,900   $68,800   $21,300  $15,400  $14,498  $7,568
Florida           $105,500   $77,100   $45,100   $15,000  $11,800   $6,612  $2,218
Georgia           $111,200   $71,300   $36,900   $14,600   $9,500   $5,235  $1,957
Hawaii            $272,700  $245,300  $118,100   $35,100  $20,900  $12,283     NA
Idaho             $106,300   $58,200   $45,600   $14,100  $10,600   $5,852  $1,600
Illinois          $130,800   $80,900   $52,800   $19,800  $14,700   $8,646  $3,277
Indiana            $94,300   $53,900   $37,200   $13,800  $10,200   $6,226  $2,406
Iowa               $82,500   $45,900   $40,600   $13,900   $9,900   $6,320  $2,253
Kansas             $83,500   $52,200   $37,800   $12,100   $9,300   $5,462  $1,733
Kentucky           $86,700   $50,500   $34,200   $12,600   $8,800   $5,283  $2,074
Louisiana          $85,000   $58,500   $43,000   $14,600  $10,700   $5,141  $1,414
Maine              $98,700   $87,400   $37,900   $12,800   $8,800   $4,856  $2,008
Maryland          $146,000  $116,500   $58,300   $18,700  $11,900   $8,033  $3,031
Massachusetts     $185,700  $162,800   $48,400   $20,600  $13,800   $9,144  $3,837
Michigan          $115,600   $60,600   $39,000   $17,500  $12,000   $7,496  $2,863
Minnesota         $122,400   $74,000   $53,100   $18,000  $12,800   $7,806  $3,024
Mississippi        $71,400   $45,600   $31,400   $11,200   $7,900   $4,159  $1,189
Missouri           $89,900   $59,800   $36,700   $14,400  $10,900   $6,399  $2,392
Montana            $99,500   $56,600   $46,500   $14,000  $10,900   $5,797  $1,651
Nebraska           $88,000   $50,400   $38,000   $12,400   $9,400   $5,918  $2,156
Nevada            $142,000   $95,700   $68,700   $22,400  $15,200   $8,859  $1,987
New Hampshire     $133,300  $129,400   $48,000   $16,400  $10,700   $6,199  $2,505
New Jersey        $170,800  $162,300   $60,200   $23,400  $15,600  $10,408  $4,528
New Mexico        $108,100   $70,100   $45,300   $13,000  $10,700   $5,697    $656
New York          $148,700  $131,600   $45,600   $22,500  $15,300  $10,152  $4,389
North Carolina    $108,300   $65,800   $36,000   $12,800   $8,000   $4,901  $1,802
North Dakota       $74,400   $50,800   $43,900   $13,000   $9,800   $5,396  $1,626
Ohio              $103,700   $63,500   $44,900   $17,600  $13,400   $8,304  $3,415
Oklahoma           $70,700   $48,100   $35,600   $11,100   $7,900   $5,228  $1,293
Oregon            $152,100   $67,100   $56,900   $15,400  $10,500   $6,846  $2,343
Pennsylvania       $97,000   $69,700   $39,100   $13,600  $10,200   $6,992  $3,205
Rhode Island      $133,000  $133,500   $46,800   $18,200  $12,300   $9,767  $3,848
South Carolina     $94,900   $61,100   $35,100   $13,000   $7,500   $5,112  $2,145
South Dakota       $79,600   $45,200   $36,600   $11,400   $8,800   $5,410  $1,618
Tennessee          $93,000   $58,400   $35,600   $12,500   $8,300   $5,268  $1,826
Texas              $82,500   $59,600   $39,100   $12,000   $8,800   $5,805  $1,693
Utah              $146,100   $68,900   $57,300   $16,800  $12,600   $7,409  $2,320
Vermont           $111,500   $95,500   $42,200   $16,400   $9,700   $6,277  $2,836
Virginia          $125,400   $91,000   $48,000   $17,100  $10,800   $6,581  $2,633
Washington        $168,300   $93,400   $59,900   $18,500  $11,700   $7,169  $2,359
West Virginia      $72,800   $47,900   $38,500   $11,300   $7,600   $5,473  $2,350
Wisconsin         $112,200   $62,500   $48,600   $17,300  $12,600   $7,927  $3,232
Wyoming            $96,600   $61,600   $59,800   $15,300  $12,300   $6,811  $2,174

NA:  Not Available
Source:  U.S. Census Bureau