Protein Quality Visualization Tool

Protein Quality Visualization Tool

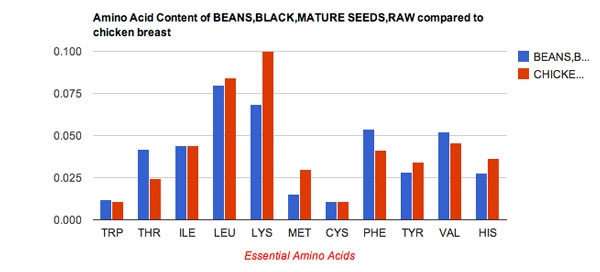
This advanced tool lets you visually compare protein quality of over 5000 foods to grilled chicken. See essential amino acids. macros and more!  At a glance you can see how good the protein quality is by comparing its amino acid profile to a high quality protein like chicken.

Protein-Comparison

BEANS,BLACK,MATURE SEEDS,RAW         CHICKEN,BROILER,ROTISSERIE,BBQ,BREAST MEAT ONLY
Calories (g) 15.787 5.13552
Protein (g) 1.0000 1.0000
Fat (g) 0.065741 0.127318
Carbs (g) 2.88704 0
Omega-III ALA (g) 0 0
Omega-III EPA (g) 0 0
Omega-III DHA (g) 0 0

Amino Acids Per Gram Protein

Amino Acid

$BEANS,BLACK TURTLE,MATURE SEEDS,RAW

CHICKEN
Tryptophan

0.011859

0.01077
Threonine

0.042071

0.024322
Isoleucine

0.044141

0.04383
Leucine

0.079859

0.084023
Lysine

0.068659

0.1
Methionine

0.015059

0.029708
Cystine

0.010871

0.010699
Phenylalanine

0.054071

0.041084
Tyrosine

0.028141

0.034058
Valine

0.052329

0.045613
Arginine

0.061929

0.063873
Histidine

0.027859

0.036626
Alanine

0.041929

0.049501
Aspartic Acid

0.120941

0.058987
Glutamic Acid

0.152471

0.112981
Glycine

0.039059

0.042332
Proline

0.0424

0.037447
Serline

0.0544

0.033131